Meet Customer Requirements Profitably
If you drive past a petrochemical plant, you will probably wonder what the tall shiny structures are. It is likely that they are distillation columns used to obtain purified liquids from mixtures. For example, distillation is used to produce alcoholic beverages, gasoline and distilled water.
In the distillation, as with other processes, the goal is to produce a product that the customer wants — profitably. The customer requires that the concentration of impurity in the product be within a specified limit. If the impurity is outside the limit, the product must be thrown away or recycled. If the impurity is well within the limit, there is “give away” of quality and processing costs are higher than necessary. Thus, the ability to measure the impurity quickly is essential for meeting customer requirements at minimum cost.
Motivation
Measuring the impurity level accurately using an instrument called an “analyzer” can be time consuming resulting in production of off-spec product before a problem is detected. There is a need for a quick and reliable method to estimate the impurity level.
Distillation columns are often instrumented to measure other operating parameters — pressures, flow rates and temperatures at multiple locations. These measurements are almost instantaneous. A model relating the impurity level to the temperature and flow measurements may provide a fast and acceptable solution for quickly estimating the impurity level.
The impurity-estimation method would have to answer the following questions:
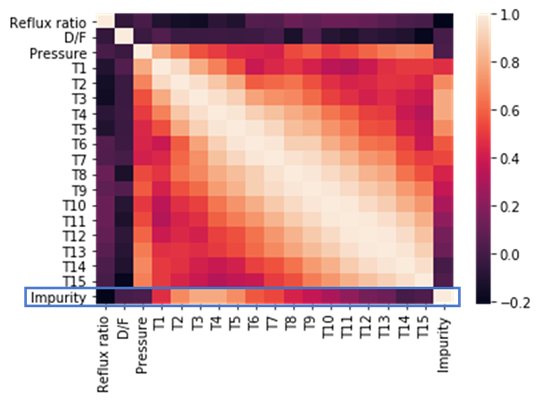
Question 1: Distillation columns are often instrumented to measure other operating parameters — pressure, flow rates and temperatures at multiple locations. Might it be possible to estimate the impurity level based on other operating parameters?
The heat map shows that several temperature measurements have high correlation with the impurity level (blue rectangle).

Based on this exploratory data analysis, the answer is “Yes, it may be possible.”
Question 2: Could the impurity level be estimated even if some of the other parameters are occasionally unavailable?
It is believed that the large number of measurements provides sufficient redundancy to predict the impurity by assuming mean values in place of missing data. Different ways to fill in the missing data may have to be explored.
Question 3: Will the impurity-estimation method be accurate enough for deployment?
A linear model obtained by regressing the impurity versus the temperature and flow measurements has an R-squared of approximately 0.88 for the training set and 0.82 for the test set. The test set fit would be considered “moderately good” for this particular application as the process would need to be operated with a sufficiently large cushion so that prediction errors would not result in off-spec product. However, increasing the operating cushion usually increases processing cost (reduces profitablity). A more accurate model (R-squared of 0.95) would be desirable.


Further, the above graphs show that the model under predicts at high impurity levels. This bias would restrict model use to low impurity levels.
Conclusions
- The under prediction at high impurity suggests that a non-linear modeling strategy may be beneficial;
- It is possible that using the mean to replace missing values is affecting the model fit (R-squared). A different method to deal with missing values could be explored;
- Finally, looking at the data scatter, even at low impurity (bottom-left area of the above scatter plots), could be an indication that the data is too noisy and no model will produce the desired R-squared. This would suggest upgrading the process instrumentation to produce less-noisy data.
For Further Information:
The data and python code (Jupyter notebook) behind the model can be found here.
Title photo from https://www.beltandroad.news/2019/05/04/energy-china-to-build-3-6-billion-crude-refinery-in-pakistan/
